

Research stats that stand out
Examples from PlanGrid, Snyk, Okta, Gong, Prof G & Zenput


A valuable lesson I’ve learned by running multiple marketing surveys / research / reports over the years: make your research stats and content more valuable by capturing real numbers (integers) as opposed to relying entirely on percentages.
For instance:
"Employees spend 7 hours per week on average updating CRM records."
…instead of:
"63% of employees say they spend too much time every week updating CRM records." or “Employees spend 17% of their time updating CRM records.”
(these stats are made up)

Original research reports are a unique mechanism for B2B marketers to both create brand awareness (through earned media and social sharing like the example above), and to generate leads and drive revenue.
Most companies do this by surveying professionals in their industry and/or by analyzing their own customer data. But to be effective, the stats have to stand out – be original, interesting, insightful, actionable.
Percentages, stack ranking, correlations, and other types of stats can tell interesting stories, but it’s easy for them to be underwhelming. A stat like “63% of employees say __________” might be true, but it’s not convincing. And if that percentage were in the 80s or 90s, there’s a good chance the finding is already obvious to the audience and not terribly insightful.
The “7 hours” stat however, sounds credible and is ultimately more valuable for sales, marketing, and other teams.
Sales can prompt meaningful conversations with prospects. A sales person can go to a prospect and say "So we've found that with brands like yours, employees typically spend 7 hours per week updating CRM records, does that sound right? How much time does your team spend? What are they spending too much/too little time on?" Real numbers open doors for a deeper conversation.
Marketing can connect to macro/financial insights. Marketing teams can use that data to back into other meaningful stats. e.g. if you know the hourly wage of the average employee (for a specific industry for example) you can estimate the economic impact of that time spent: see the screenshot above where PlanGrid estimated $177B global waste.
Product management can defend product decisions. Product management teams can quantify problems/opportunities for decision-making. If prioritizing a list of new product opportunities, knowing the exact number of times that an activity is performed weekly, or the hourly cost of that activity, etc. can help drive decision-making about product roadmap.
Prospects can relate more quickly/easily to the stat you shared — it almost forces one to think: do I spend that much money, time, etc. on that activity, how much time, etc.? Whereas a percentage is easier to dismiss as irrelevant to you.
Here are a few examples to help illustrate the power of real numbers, and some examples of how other companies could have reframed their research questions to deliver more interesting stats and insights.
5 examples of marketing stats that stand out
…and how 2 could be improved.
PlanGrid
At PlanGrid in 2018 we published Construction Disconnected, our first-ever research report which provided new insights with big numbers – billions of dollars in waste, specific numbers of hours construction professionals spent on different activities, and much more.

It was a wild success: it contributed millions in new pipeline and earned over 33 press hits just in the first few months.
Scott Galloway
“Prof G” or Scott Galloway is a professor of marketing at the NYU Stern school and one of the more active trolls scholars on social media. In a recent article “Welfare Queens” he called out how large corporations love to trash the US government even as they take many billions of dollars in grants and subsidies from said government.

A chart that shows what percentage of total government subsidies Amazon received since 2000 might not be all that compelling. But because the chart shows the volume in dollars, the reader can more easily grasp the level of government support these companies have received.
Zenput
From a customer ROI survey we ran at Zenput:

The time-savings stats are great, but I particularly loved the third one here – that District Managers who use Zenput are able to do their job so much more effectively that they can oversee two or more additional stores (e.g. nine stores instead of seven).
An executive for a fast food company could see this and immediately envision not needing to hire several additional District Managers (clutch at a time when staffing is so difficult).
Snyk
Snyk’s State of Cloud Native Application Security Report is insightful, but would be more interesting and provocative if it included more real numbers instead of percentages.
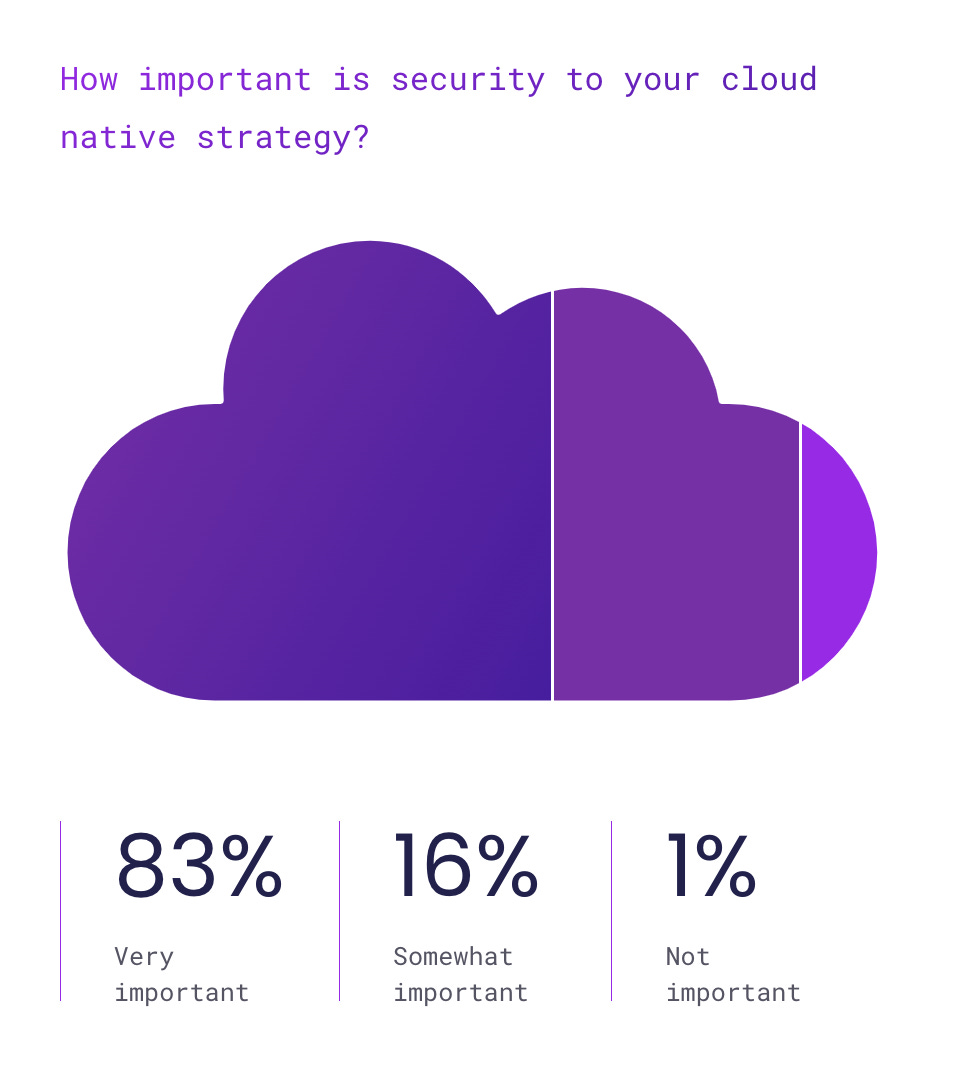
This is a great stat. If you’re a security developer or CTO or whoever that sees this and you don’t think security is all that important for cloud applications, then this should help create FUD that it should be very important for you. But the conversation stops there.
A way to make this area of research even more insightful could be to ask the audience what their budget for security is this year e.g. “Tech companies will spend $XX,XXX,XXX on security for cloud native strategies in 2023, a XX% increase over 2022.”
With a stat like that, a sales person can more easily have a conversation not only about the importance (or non-importance) of cloud security, but also do more discovery with the prospect about budget allocation, justification, etc. and move the deal forward.
DemandScience
Remote work continues to be a hot topic in every industry, as companies continue to struggle with whether or not to require employees to come back to the office.
In a recent report by DemandScience titled Post-Pandemic Culture and the Impact on B2B Sales & Marketing, they offered this stat:

I like the idea of this stat, but it just falls flat – if the stat were 50% it would be a wash i.e. useless, so 60% isn’t exactly convincing. But a more convincing way to tell a story about marketing team productivity in a remote environment would be to do research that would provide real numbers, such as (numbers are made up):
Marketing teams that offer remote work have a median tenure of 2.5 years, vs. 1.5 years for teams with an in-office or hybrid policy
Marketing teams that offer remote work have employee engagement of 80 or higher, vs. 70 or lower for teams with an in-office or hybrid policy
I’m not saying it’s always easy to get these numbers by the way. But the exercise here is to learn from good and not-so-good examples.
Okta
One reason Okta’s Business at Work report is so popular every year is its ranking of the fastest-growing apps.

Even though this chart is full of percentages, it’s really valuable because it provides:
stack-ranking of multiple companies
year-over-year growth trends (vs. a static percentage)
Another example: I could create a chart that ranks the top strategic priorities for CTOs this year. But it would be even more valuable if if I also show you 1) the distribution (percentages) of those priorities e.g. if “Security” was chosen by 94% of respondents, and 2) how that list compares to last year’s list of priorities (yoy change).
Gong
Gong creates a lot of original data and research. They rely heavily on percentages, but they make it interesting and actionable by always offering comparisons of what “Top performers” do versus an “Average performer.”

A weaker version of this stat could have been something like “85.3% of sales people respond to objections with a question,” which sounds insightful but isn’t. Instead, the comparison between “Top” and “Average” performers makes the stats infinitely more valuable. What about the real numbers? Well they actually provide those stats too:
